Published
- 3 min read
How to Identify a JavaScript Error in a Browser

Here’s the revised content with an NLP-friendly and conversational tone:
How to Find and Fix JavaScript Errors in Your Browser
JavaScript errors are a normal part of web development. Whether you’re working on a small website or a big app, knowing how to spot and fix these errors is key. This guide will show you simple steps to debug JavaScript errors using browser tools.
What Are JavaScript Errors?
JavaScript errors happen when your code doesn’t run as expected. This could be due to typos, missing files, or issues that only show up while the code is running. The first step to fixing an error is understanding its cause.
Common Types of JavaScript Errors
1. Syntax Errors
These occur when your code has a typo or structural mistake.
Example:
console.log("Hello World // Missing closing quote2. Reference Errors
These happen when you try to use a variable or function that doesn’t exist.
Example:
console.log(undeclaredVariable) // Variable not defined3. Type Errors
These show up when you try to perform an operation on the wrong type.
Example:
null.toUpperCase() // Cannot call a method on null4. Range Errors
These occur when a number goes beyond its allowed range.
Example:
const num = Math.pow(10, 10000) // Too largeHow to Identify JavaScript Errors
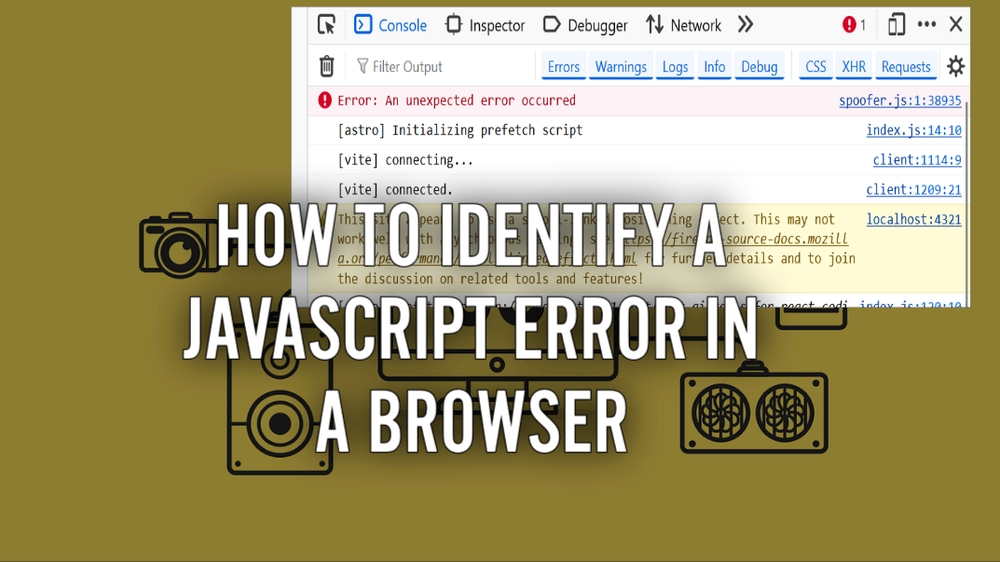
1. Use the Browser Console
Every browser has developer tools to help you debug.
Steps to Check Errors:
- Press F12 or Ctrl+Shift+I (Windows/Linux) or Cmd+Option+I (Mac).
- Go to the Console tab to see error messages.
- Look for red error messages showing the type, file, and line number.
Example Error Message:
       Uncaught ReferenceError: myFunction is not defined
at index.html:15
This means myFunction was called but not defined, and the error is on line 15.
2. Use the Source Tab
The Source tab lets you find the exact line of code causing the error.
Steps:
- Open the Source tab in Developer Tools.
- Click the file where the error occurred.
- Set a breakpoint on the error line by clicking its number.
- Step through your code to understand what’s going wrong.
3. Log Errors in Your Code
You can add error-handling to catch problems directly in your code.
Example:
       try {
	undefinedFunction() // Throws an error
} catch (error) {
	console.error('Error caught:', error.message)
}
Output:
Error caught: undefinedFunction is not defined4. Check the Network Tab
Sometimes errors occur because files fail to load.
Steps:
- Go to the Network tab in Developer Tools.
- Reload the page.
- Look for red-highlighted items indicating failed file requests.
5. Use Extensions and Debugging Tools
- React Developer Tools: For React apps.
- Vue Devtools: For Vue.js projects.
- Lighthouse: To check page performance and errors.
Tips for Debugging JavaScript Errors
- Keep the console open while working to catch errors immediately.
- Use linters like ESLint to spot issues in your code editor.
- Write clean, simple code to reduce errors.
- Add comments to explain complex code.
- Test small sections of code to find problems faster.
Why Fixing Errors Is Important
Fixing errors makes your site:
- Better for users: Errors can break functionality.
- Faster: Fewer errors mean smoother performance.
- SEO-friendly: A working site ranks better on search engines.
Conclusion
Debugging JavaScript errors doesn’t have to be hard. Use your browser’s developer tools, add error logs, and follow coding best practices to keep your code clean. Start exploring these tools today to handle any JavaScript challenge confidently!
FAQs
Q: What’s the easiest way to debug JavaScript?
A: Use your browser’s Console and Source tabs.
Q: Can I debug JavaScript outside a browser?
A: Yes, tools like Node.js and VS Code let you debug server-side JavaScript.
Q: Are there tools to prevent JavaScript errors?
A: Linters like ESLint can catch errors before your code runs.
